


The AI you rent and the AI you build
Explainable AI, or XAI, is the set of methods and practices that let you understand how a machine learning model arrived at a particular prediction. I would say that XAI is mostly a mindset, and only secondarily a toolset. The methods matter, but they matter much less than how the project is set up, who is in the room when the features are designed, and how the model is built up over time. Most of the value of explainability is generated long before any XAI method is applied.
There are three concrete reasons why explainability matters.
-
The first is the detection of conscious or unconscious bias. A model that learns from human-generated data will also learn the biases embedded in that data, and the only way to find these biases is to be able to look inside the model.
-
The second is the establishment of trust. In regulated industries especially, but really anywhere a decision matters, people will not act on a prediction they cannot interrogate.
-
The third, which gets less attention than it deserves, is data leakage detection. A model that performs suspiciously well in training is often a model that has learned something it should not have access to, and explainability is the best way to catch this before the model ships. Trust leads to usage, and usage is what actually generates business value. A model that nobody trusts is a model that sits unused on a server.
Most discussion of XAI focuses on the technical methods. But in my experience, the methods are not where the value comes from. The biggest part of the work is what happens between data and model. Feature design. Experiment design. The careful, slow, often unglamorous process of building understanding alongside the model, so that by the time you reach for any XAI method at all, you already know what you are looking at.
Explanations without understanding do not help anyone, and understanding is mostly built through communication - between the data scientist and the domain expert, and eventually between the model and the people who need to use its outputs.

I want to walk through a concrete example. A few years ago, working with Fetch, a US pet insurance company, we built a disease prediction model that today powers Fetch Health Forecast - a wellness product that gives dog owners a personalized view of their dog's most likely future health conditions. The model predicts the likelihood of 45 disease categories from insurance claims history, breed, age, and environmental factors. It runs over insurance data from 785,565 dogs collected over 17 years. The methodology is documented in a paper we published in Scientific Reports; the link is at the end.
The collaboration was with Audrey Ruple, Professor of Veterinary Medical Informatics at Virginia Tech, and Aliya McCullough, Chief Veterinary Officer at Fetch. What I want to write about here is not the model results but the process between data scientists and domain experts that led to a trustworthy AI product that shipped.
Explainability starts in feature design
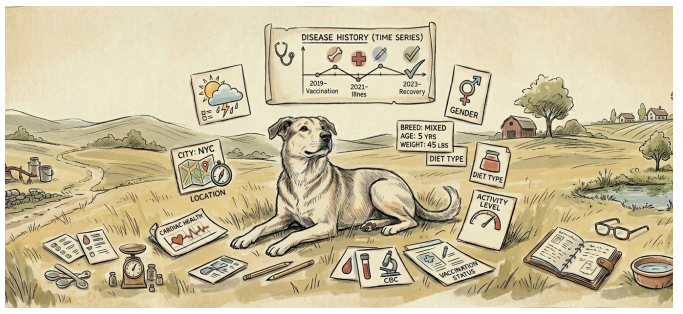
The first place explainability lives is in the features. Without veterinary knowledge on the team, we could not have built features that were meaningful to either the model or the people who would later read its outputs.
The raw data had over 500 individual dog breeds, many with very small sample sizes. Grouping them required input from the vet side, and the groupings came from genetic relationship trees rather than from anything a data scientist would have invented. Same story for the environmental features.
Each dog had a zip code, which on its own is not useful. What matters is what you map it to. A zip code can be mapped to hundreds of derived features, and the question is which of them have a known reason to correlate with disease occurrence in dogs. City versus countryside is one example - urban dogs and rural dogs have different disease profiles, and the model needs that distinction without us having to spoon-feed it the breakdown.
Veterinary literature pointed us to the features that mattered, and we selected those and left the rest out.
The only way to build features you can explain in a domain like veterinary medicine is to have a domain expert in the room. Not at the kickoff. In the room.
> Rule of explainability #1: Features you cannot explain are features you should not have.
Build the stupid model first
The second place explainability lives is in the experiment design. This is the part most people skip, so I want to spend more time on it.
Before we built the full model, we built two deliberately stupid ones:
-
One that knew only the dog's breed.
-
One that knew only the dog's age.
We expected both to perform just above random, with an AUC slightly above 50%.
The breed-only model came in at 60.4%. The age-only model was similar in shape.
These are not impressive numbers, and that is the point. The stupid models verify two things:
-
The first is that the model finds signal where signal should exist. The breed-only model should be able to identify, for example, that English bulldogs have a higher risk for dermatological diseases, that dachshunds have a higher risk for disc diseases, that German shepherds have a higher risk for skeletal conformation disorders. These patterns are well documented in veterinary literature. If the model failed to find them, something would be wrong upstream and we would want to know before we built anything more complex.
-
The second thing the stupid models verify is that the model does not find more signal than it should. A breed-only model with an AUC of 85% would be suspicious. It would suggest the breed feature is leaking information from elsewhere, or that we have made a methodological mistake. Robust performance with low capacity is the goal here, and this is one of the most effective ways I know to catch data leakage early.
The stupid model also gives you a way to talk to the domain expert. You can show the veterinarian the breed-only predictions and ask: does this match what you would expect to see? If yes, you have a baseline of trust before you have built anything complicated. If no, you find out why before you have built anything complicated.
After the stupid models, we added features piece by piece:
-
Disease history alone.
-
Disease history plus breed.
-
Disease history plus breed plus age.
-
Then breed group.
-
Then breed characteristics.
-
Then environmental features.
-
Then climate on top of that.
At each step we measured the AUC and watched for where the jumps were. Some additions moved the AUC a lot. Combining individual disease history with breed information improved the AUC by ten to fifteen percent over either feature group alone, which tells you that breed and disease history are jointly informative in a way that neither is by itself.
Some additions moved the AUC barely at all. Adding climate features on top of the residential features added less than half a percent, which tells you that climate has a real but small effect on disease likelihood compared to the other features in the model. That is also useful to know - it tells you not to over-invest in collecting more granular climate data later.
Both kinds of observations help you defend the model: if anyone asks why a particular feature is in the model, you have a concrete answer based on what it added. This incremental approach is, I would say, one of the most useful habits in modeling work. (It is also slower than throwing everything at XGBoost and seeing what comes out, which is why most people skip it.)
> Rule of explainability #2: "If your simple model is too good, it is not simple enough"
Explainability in stages
By the time we ran XAI methods on the final model, we already understood what we were looking at. The methods served as confirmation - we used them to verify that what the model had learned matched what we expected, and to surface anything we had missed.
There are many XAI methods available, but for a wide class of problems two of them do most of the work: feature importance and partial dependence plots, applied in that order.
- Feature importance is a measure of how much each feature contributed to reducing prediction error across the model.
- Partial dependence plots, or PDPs, then show how the model's prediction changes as a single feature varies, with all other features held at their average.
Here is what feature importance looked like for two of the disease categories we predicted.
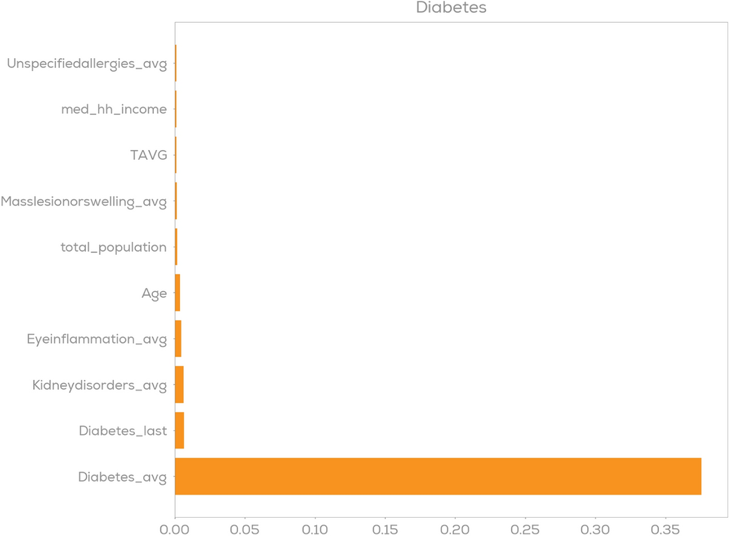
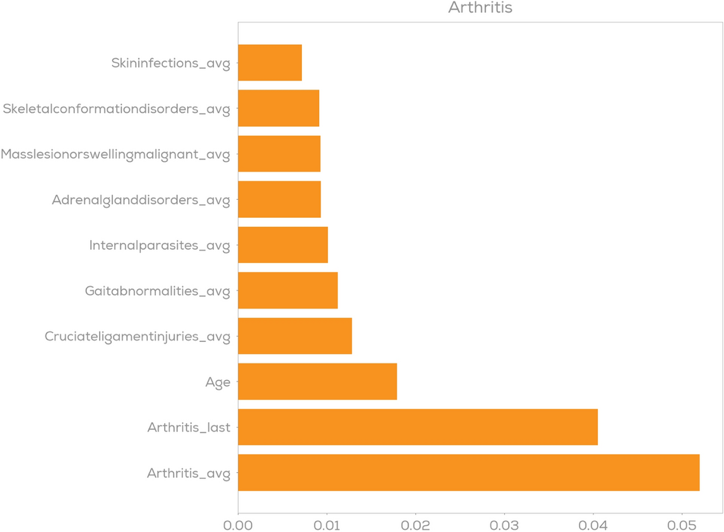
Figure 1: Feature importance for diabetes (left) and arthritis (right)
For diabetes (left figure), one feature dominated everything else: the average number of previous diabetes claims for the same dog (Diabetes_avg). The model had mostly learned that diabetes is chronic - once a dog has been diagnosed, the likelihood of further claims related to it is very high. This is well known in veterinary practice. But what the feature importance plot reveals changes what you do afterwards.
A high AUC for diabetes prediction looks impressive in the headline, but in practice the prediction "this dog with previous diabetes claims is likely to have more diabetes claims" is not useful to the owner. They already know the dog has diabetes. The model's value in diabetes prediction is actually limited, and the feature importance plot makes that obvious.
For arthritis (right figure), the shape is completely different. The disease's own history still matters most, but a much broader set of features contributes: age, cruciate ligament injuries, gait abnormalities, internal parasites, adrenal gland disorders, and several others. This is a model with more to say. A prediction of "this older Labrador with a cruciate ligament history is at elevated risk for arthritis" is informative. The owner does not know this, the model arrives at it from a combination of features, and it points toward concrete preventive action.
The same model architecture, the same training data, but a fundamentally different practical use case depending on which disease you ask it about.
Feature importance tells you what mattered for arthritis. To understand how it mattered - in which direction - we need partial dependence plots.
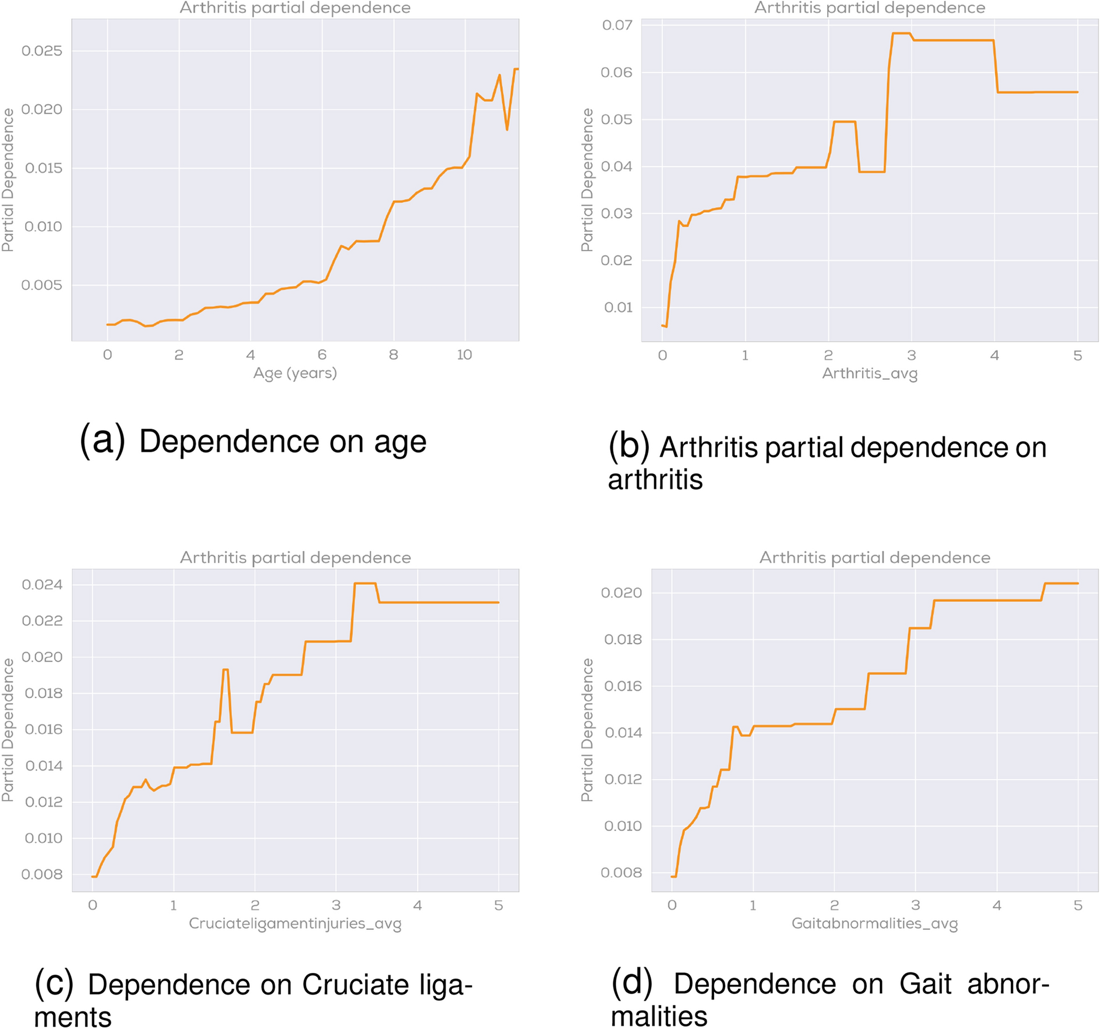
Figure 2: Partial dependence plots for arthritis prediction
-
The age plot (upper left) rises steadily through the years - older dogs are at higher risk, with the curve climbing fastest in middle age and then flattening slightly.
-
The arthritis-history plot (upper right) rises sharply with even a small number of previous claims and then plateaus - the model has learned that one or two previous arthritis events already shift the risk meaningfully, and additional events do not add much more.
-
The cruciate ligament and gait abnormality plots (lower left and lower right) rise more gradually but in the same general shape.
All four patterns are confirmed by existing veterinary literature on canine osteoarthritis. Nothing here was a surprise to the veterinarians on the team. That is the point. The model is making the same kinds of inferences they would make, just at scale, and the plots show this in a way they can read.
Feature importance and partial dependence plots are not the newest XAI methods. SHAP gets more attention. Counterfactuals get more attention. Surrogate models get more attention.
But these two methods have one quality that matters more than novelty: a veterinarian, or a doctor, or a lawyer, can read them. The goal of XAI is not explanation. The goal is understanding. These are different things, and feature importance plus PDPs deliver understanding more often than people give them credit for.
> Rule of explainability #3: Use methods your audience can read
The headline number
The average AUC across all 45 diseases was about 81%.
Like most headline numbers, it hides everything. The individual per-disease AUCs ranged from 69% for vomiting and diarrhea to 94% for diabetes. The model is much better at some things than at others - mostly the chronic conditions, where previous claims are strong predictors.
For some diseases it is barely better than random, because the underlying events are inherently unpredictable from the kind of data we had. Stratification by disease was the point. Without it, the model would have looked uniformly good. With it, you understand what the model can and cannot do, and you build products accordingly.
> Rule of explainability #4: "Stratify before you ship"
What this means in practice
Explainability cannot be retrofitted. The practical version of that statement is more specific: explainability is built into the features, into the experiment design, into the per-class evaluation, long before you reach for any XAI method.
If you have done those things well, the model is mostly understood by the time you run feature importance or PDPs against it. If you have not done them, no XAI method will save you.
You will get plots, but you will not get understanding. And understanding is
the actual goal.
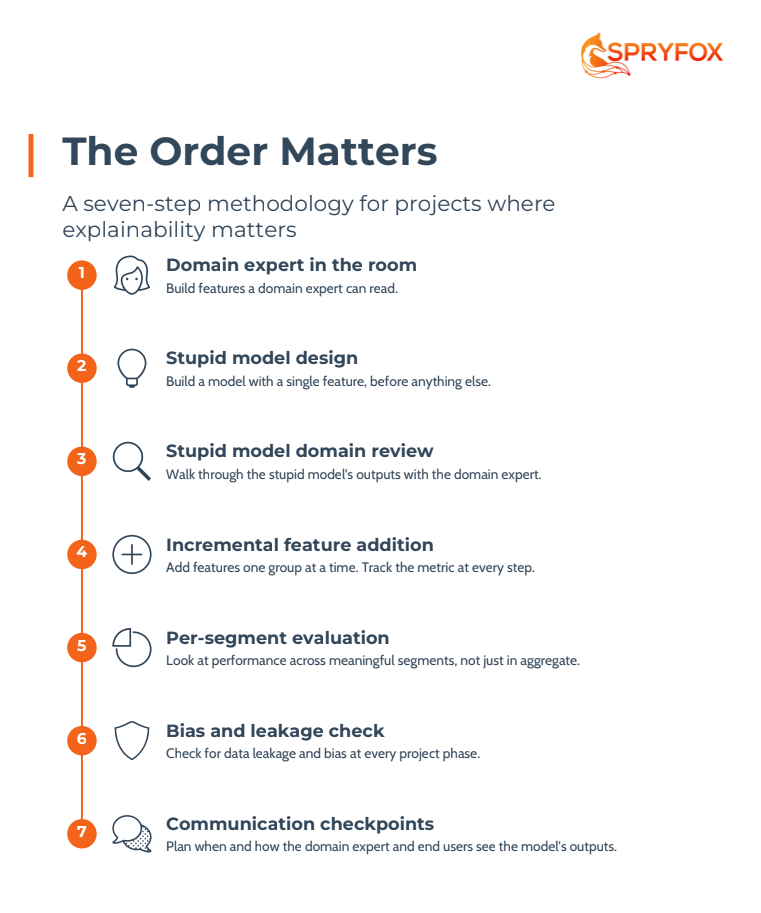
The process - build with a domain expert, build the stupid model first, add features piece by piece, watch where the jumps are, evaluate per class, then explain - is what made Fetch Health Forecast possible. The arthritis prediction for an older Labrador, which I used as an example earlier, is the kind of output that ends up in front of a real owner. The reason it can be put in front of a real owner is that the methodology behind it produced something the team at Fetch could trust and act on.
> Rule of explainability #5: Trust leads to usage, and usage is what generates value.
Want to see how explainable AI applies to your business? Reach out to Dr. Christian Debes here to talk it .
References
Debes, C., Wowra, J., Manzoor, S., Ruple, A. (2023). Predicting health outcomes in dogs using insurance claims data. Scientific Reports, 13, 9122. https://doi.org/10.1038/s41598-023-36023-5
Figures 1 and 2 reproduced from the above paper under CC BY 4.0.